Call: 01245 807 360
SECURE LOGIN
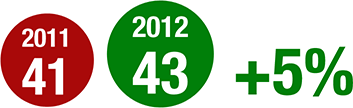
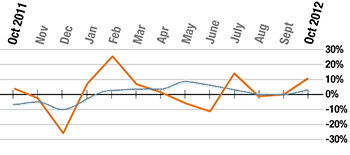


November starts to see a slowdown so now might be a good time to review your membership options and make any changes.
How these stats are collated
These monthly statistics are generated using an anonymous set of 40 gyms throughout the UK chosen at random. Each month the same gyms are used to keep the results consistent and accurate. to meet print and publication deadlines months are calculated as the 16th of the previous month to the 15th of the current month.